Solar Monitoring
In May 2023 we finally joined the "renewable revolution" by having photovoltaic panels installed on the roof and purchasing an inverter to feed power into the grid. Of course one of the main fascinations of the system is that one can acquire performance data from the system and graph that data to see how the system is doing. "kWh peeping" instead of "pixel peeping" if you will...
There are lots of howtos describing how to configure things like ioBroker or Home Assistant, using all kinds of convoluted ways to get to the data. These are nice open source systems and if you're already invested into them, or appreciate things they offer such as vioce control and the overall integration, by all means go for it.
In my mind not putting everything into one silo is better, and you can fix yourself what you built yourself. Thus what I'm describing here is my way, which aims to be mostly custom-built and without creating dependencies on complicated smart home software and/or proprietary services. And of course be entirely on-prem, because "There's no cloud here, partner"...
Strap in, this is going to be a long one.
Hardware
We have 14x 400W solar panels on the roof, which are divided into 2 strings. Both strings are wired into a SMA Sunny Boy 5kW inverter, which in turn is connected to the internal 50A house wiring coming from the electricity meter. At the time of this writing the most recent firmware version 4.0.75.R was installed.
The meter itself currently is still an electro-mechanical Ferraris meter (the ones with the rotating dial and analog readout). We have a two-tier contract with the electricity supplier, and the meter has two counter sections for peak and off-peak power. The meter is switched between the two counters using ripple control. When feeding power into the grid the dial (and active counter) simply run backwards, reducing the displayed number of kWhs consumed from the grid. This is a quite advantageous arrangement and is the main reason we don't convert to a single-tier tariff - this would undoubtedly bring a "smart" meter and I don't want that. It does, however, force us to control off-peak power consumption because the only power which the off-peak meter sees is produced during daytime on the weekends.
Software
The SMA inverter has both a fixed ethernet as well as a Wifi interface, through either one of which it is connected to the customer's home network. The management module can be accessed locally with a web browser and several other protocols.
Web Interface
The SMA inverter has a web interface. There are two default user levels defined, "User" and "Installer". Depending on your installer you will receive either one or both passwords. If not you can always use the password reset policy which can be initiated from the web interface and requires you to enter the WPA secret that is printed on a sticker attached to the side of the unit (and should promptly be added to your password safe for later use).
SMA Cloud
Of course there's "cloud" connectivity. The integrated management module calls out to SMA's monitoring system. This is an application hosted in ms Azure which collects the performance data of all SMA systems globally. The installer will add the inverter to the system including a user email address. The system then sends out an email with instructions for the customer on how to create an account. They are then able to monitor the installation's performance also while on the road.
Apps are available for Android and iOS to visualize the data, or alternatively a not very mobile-friendly web interface can also be used. There are also APIs available to access this data at the SMA Developer Portal but I haven't investigated them.
This traffic is using port 9524 and uses websockets over TLS. An example packet capture looks like this (192.168.2.140 is the internal address of the inverter on my network):
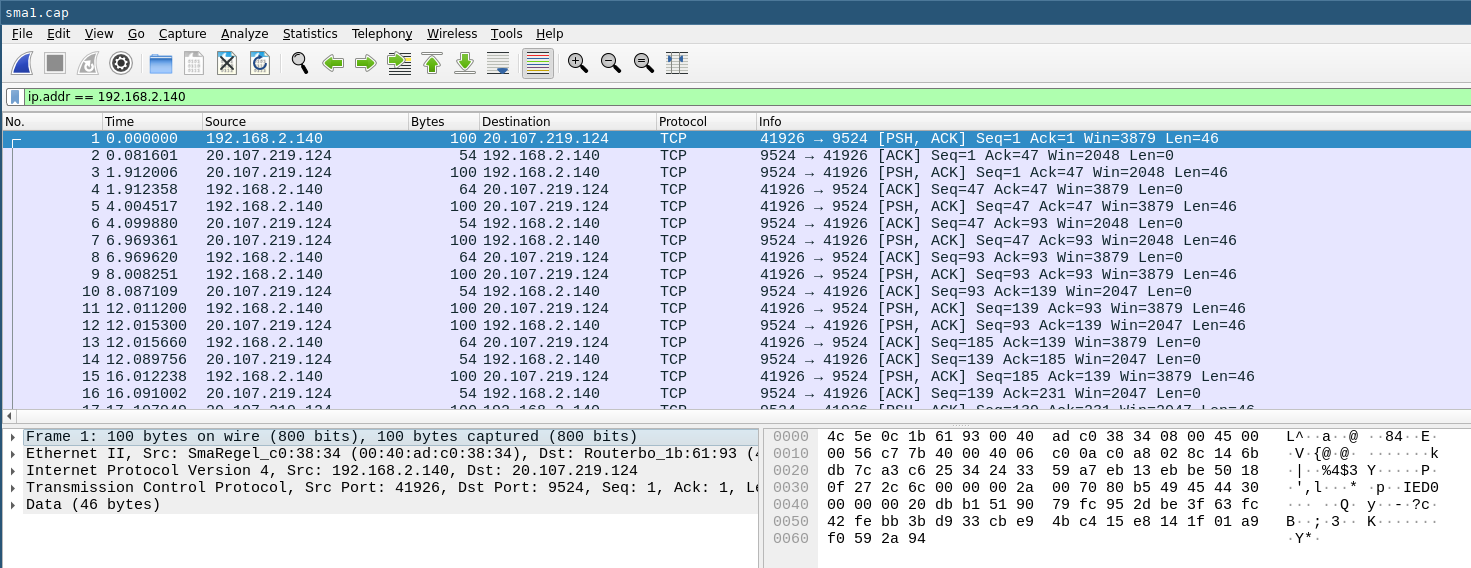
It should be noted that the inverter seemingly uses the "Installer" credentials to authenticate against the cloud endpoint. If you reset the password for that role the cloud connectivity will not work anymore. You will then need to contact your installer to change this on the SMA cloud end. Changing the user password has no adverse effect, but some settings cannot be changed from "User" level. It is probably best to leave the "Installer" password alone if you have no need to change anything and do want to use the SMA cloud and app.
Other protocols
The management module also supports other protocols, which need to be enabled to interact with them. This is dependent on the device and firmware version, and generally requires "Installer" level access.
My inverter supports an SMA-proprietary grid management protocol; Modbus over TCP; and something called Speedwire. Speedwire runs over ethernet, is IPv4 only, and uses UDP on the transport layer. The payload is a protocol called SMA Data2+. This protocol is used by SMA products such as the Cluster Controller, Sunny Home Manager, and the SMA Energy Meter.
Data Acquisition
Following the system monitoring philosophy there are three phases:
- obtaining data
- publishing data
- consuming data
As described above there are multiple ways to obtain data from the inverter. Disregarding proprietary and expensive hardware or software solutions one could use Modbus/TCP, or use the CSV file download function in the web interface. Modbus would be an option if you're an automation type.
The best way for my use case was leveraging a relatively new function called "Smart Inverter Screen". This enables a small Web API which can be accessed to obtain JSON-encoded values using any sort of client software.
To get started, enable this feature in the "User" role setting pulldown menu. The web interface will look essentially unchanged, but there are now deep links available that begin with https://1.2.3.4/dyn/...
Manual Test
Start by running this curl command, replacing PASSWORD with the "User" level password and using your inverter's IP address:
curl -k -H "Content-Type: application/json, Accept-Charset: UTF-8" -X POST \
    -d '{"pass" : "PASSWORD", "right" : "usr"}' \
    https://192.168.2.140/dyn/login.json
# returns
{"result":{"sid":"45WX-yRxCQN2gyx1"}}
This will return a JSON-encoded session ID as shown. This ID inconveniently expires after a certain inactivity, about 10 minutes. If you're quick enough with the manual tests you can continue using it; if authentication fails at some point you will have to regenerate a new session ID by executing this request again.
Ok, next we'll try and get to the data. Run this command, replacing SESSIONID with the "sid" returned by the inverter, in this example 45WX-yRxCQN2gyx1:
curl -k -H "Content-Type: application/json, Accept-Charset: UTF-8" -X POST \
    -d '{"destDev":[],"keys":["6400_00260100","6400_00262200","6100_40263F00"]}' \
    "https://192.168.2.140/dyn/getValues.json?sid=SESSIONID" | jq .
This will return a JSON-formatted result. The three keys denote the total production, today's production, and current production, respectively:
{
  "result": {
    "0199-xxxxx2F4": {
      "6400_00260100": {
        "1": [
          {
            "val": 146113
          }
        ]
      },
      "6400_00262200": {
        "1": [
          {
            "val": 27873
          }
        ]
      },
      "6100_40263F00": {
        "1": [
          {
            "val": 2436
          }
        ]
      }
    }
  }
}
Nice! If you're interested in all the available values go to the "Instantaneous Values" tab in the web interface and use the "Export" button to download a complete list including descriptions. The 3 given here seem to be the most useful, however.
Automating Data Acquisition
As mentioned at the start I am interested in the most straightforward way to acquire the data since I'm not running any smart home management software. So I've chosen to automate the above curl commands in a shell script and set up a cron job running this script every minute.
The handling of the session ID is an unfortunate implementation detail. Generally one would register an API access key which remains valid indefinitely, but this is just a session key which must be kept alive to keep it from timing out.
Additionally, SMA chose to implement a login limit to the web interface which also counts the Smart Inverter Screen sessions. Depending on the current status, multiple generated session IDs will lock out access to the web interface, displaying a "login isn't possible at this time" message.
And while we're discussing questionable implementations, the SMA software will
return a null value instead of a 0 (zero) value for any of those fields. You
can see that at night when the current production value will be null until the
panels start producing again after daybreak. Whatever consumer software you plan
on using must either tolerate that, or you can replace null with 0 in the
script.
Here's my script as a starting point:
#!/bin/bash
#
# read values for power production from SMA Sunnyboy inverter

# generate session ID
RESULT=`curl -s -k -H "Content-Type: application/json, Accept-Charset: UTF-8" -X POST -d '{"pass" : "USER_PASSWORD", "right" : "usr"}' https://192.168.2.140/dyn/login.json | jq .result.sid`

# save session ID to file for future use
if [ "$RESULT" != "null" ]
then    echo "${RESULT}" | sed 's/"//g' >/tmp/sid
else    echo "can't get sid"
fi

# get data and parse it
read -d "\n" a b c <<<`curl -s -k -H "Content-Type: application/json, Accept-Charset: UTF-8" -X POST -d '{"destDev":[],"keys":["6400_00260100","6400_00262200","6100_40263F00"]}' https://192.168.2.140/dyn/getValues.json?sid=$(cat /tmp/sid) | jq '."result"."0199-xxxxx2F4"."6400_00260100"."1"[]."val", ."result"."0199-xxxxx2F4"."6400_00262200"."1"[]."val", ."result"."0199-xxxxx2F4"."6100_40263F00"."1"[]."val"'`

# debug output
echo "total: " $a
echo "day: " $b
echo "current: " $c

# publish via MQTT
mosquitto_pub -h 192.168.2.24 -r -t "house/solar/total" -m $a
mosquitto_pub -h 192.168.2.24 -r -t "house/solar/today" -m $b
mosquitto_pub -h 192.168.2.24 -r -t "house/solar/current" -m $c
Some comments:
Block 1 - generate session ID: the "User" level password is hard-coded here. This is an obvious security problem; at least set proper permissions on the script to prevent it from being read.
Block 2 - save session ID: if a session ID could be obtained it is saved to the
file /tmp/sid which again should have the correct permissions set to prevent
unauthorized access. This is all a bit janky but will work For Now[TM].
Block 3 - get data and parse it: this applies some jq magic to unwrap the
payload data and store it in variables a, b, and c. There is no further checking
of the returned data - if the session ID didn't work for example it will just
return null values.
Block 4 - debug output: as it says on the tin. Useful for testing, could be deleted for the actual cron job.
Block 5 - publish via MQTT: this is how I communicate the values to whatever consumers there may be. See next chapter.
Data Publishing
Having acquired data now we publish it.
MQTT
My preferred method of publishing data is MQTT as it is a robust, flexible, open standard with minimal resource requirements and is available on every current computing platform and supported by many applications. For Linux the Mosquitto MQTT server is tried-and-true, I run that on my home server.
The mosquitto_pub command in the script is part of the mosquitto package and
offers a painless way to publish information to specific topics. Note the use of
the "retain" flag (-r) so the last messages are kept in memory and are sent
out to any connecting client immediately, instead of having to wait for one
update cycle.
Running the equivalent mosquitto_sub command will provide insight whether
everything is working as it should:
$ mosquitto_sub -h a200 -t \# -v
house/solar/total 474759
house/solar/today 12395
house/solar/current 4596
So we see the total produced power so far is around 474 kWh, today's production is just over 12 kWh, and at this point in time 4595 W are generated by the PV panels. Whenever the script is run by cron, a new set of values is published.
The really nice part about this setup is that any program publishing data to MQTT will have no need to know who consumes it (and in fact has no way of finding out). So changing the consumer setup, or indeed adding additional consumers, has absolutely no impact on the publishing side. It is possible to control access to certain topics if required, but this will be done inside the MQTT broker's configuration.
Data Consumption and Persistence
So far we have near-real time numbers we can look at but of course the data should be stored and ideally graphed.
In either case the consumer needs to subscribe to the correct MQTT topics1, store the data, and then provide a frontend to present graphs. There are lots of ways to accomplish that and I'll look at two options that fit my specific use cases:
- storing the data in a time series database and creating dashboards in a dynamic graphing framework. For this I'll use the current hotness; Telegraf, InfluxDB, and Grafana, also called the TIG stack.
- storing the data in a round robin database and using a minimalistic graph generator. For this I'll use RRDtool, the logging & graphing Swiss army knife for system administrators since before the bronze age.
The TIG stack
Telegraf, InfluxDB, and Grafana are what is called the TIG stack. The 3 components work together extremely well and offer a scaleable solution for all kinds of time-related data archival, retrieval, and visualization that just a few years ago even extremely expensive commercial solutions could not offer.
My notes here are intentionally sparse as I'm no expert and have borrowed heavily from the official documentation. I suggest you do, too.
InfluxDB
This is the database, and is the only component of the TIG stack to be run in a container. It just seemed logical as there isn't much to configure outside of the application's web interface. Note that this is a purely personal choice - you can run any combination or none at all of the 3 parts in containers, and they can use podman or docker according to what you have available and prefer.
Using the official Influx docker image I spun up a rootless podman container like so:
podman run --name influxdb -p 8086:8086 -v /home/containers/influxdb:/var/lib/influxdb2 docker.io/library/influxdb:latest
Without going into too much detail which is better found elsewhere, it maps
the directory /home/containers/influxdb into the container, and forwards port
8086/tcp to influxd which serves both the configuration web interface as well
as the data ingress/egress API endpoint. That's pretty much it.
To make sure the database starts on reboot or crash, here's a user systemd
unit which goes into $HOME/.config/systemd/user/influxdb.service and must be
enabled and started with the usualsystemctl --user daemon-reload; systemctl
--user enable --now influxdb`:
[Unit]
Description=Podman container-influxdb.service
Documentation=man:podman-generate-systemd(1)
Wants=network-online.target
After=network-online.target
RequiresMountsFor=/run/user/1000/containers

[Service]
Environment=PODMAN_SYSTEMD_UNIT=%n
Restart=on-failure
TimeoutStopSec=70
ExecStart=/usr/bin/podman start influxdb
ExecStop=/usr/bin/podman stop -t 10 influxdb
ExecStopPost=/usr/bin/podman stop -t 10 influxdb
PIDFile=/run/user/1000/containers/overlay-containers/c06c1adbc033ac52c801ea72539119ec5553dd66fc54ddb96fe47db5d6c4ebc/userdata/conmon.pid
Type=forking

[Install]
WantedBy=default.target
There is some post-installation configuration to be done which is explained well in the official documentation. Pay special attention to the API token, which you will need to generate and then safely store (in your password manager) as it needs to be provided to Telegraf, which we'll set up next.
Telegraf
Telegraf is the data ingestor which acquires data and feeds it into the database.
Fedora packages Telegraf in their System repo, which is nice as it thus gets updated automatically and we don't have to futz around with extra repos or containers.
After installation, have a look at the huge (11,000+ lines!) example config file. You can either chose to start from scratch with only the actually needed parts, or modify the example to suit. I did the latter and added these items:
# # Configuration for sending metrics to InfluxDB 2.0
[[outputs.influxdb_v2]]
  ## The URLs of the InfluxDB cluster nodes.
  ##
  ## Multiple URLs can be specified for a single cluster, only ONE of the
  ## urls will be written to each interval.
  ##   ex: urls = ["https://us-west-2-1.aws.cloud2.influxdata.com"]
  urls = ["http://127.0.0.1:8086"]

  ## Token for authentication.
  token = "$INFLUX_TOKEN"

  ## Organization is the name of the organization you wish to write to.
  organization = "influx"

  ## Destination bucket to write into.
  bucket = "influx"

# Read metrics from MQTT topic(s)
[[inputs.mqtt_consumer]]
  servers = ["tcp://192.168.2.24:1883"]

  ## Topics that will be subscribed to.
  topics = [
    "house/solar/total",
    "house/solar/today",
    "house/solar/current",
  ]
  data_format = "value"
  data_type = "float"
These two sections set up the influx output and one MQTT input. Telegraf handles
the MQTT protocol interactions with the broker itself, via the mqtt_consumer
plugin.
The package brings along its systemd unit file in
/usr/lib/systemd/system/telegraf.service. Move that to /etc/systemd/system/
and modify it by adding the Environment= line shown below, replacing the
InfluxDB API token you generated when configuring InfluxDB. Alternatively, you
can also add it to the environment file specified in the parameter EnvironmentFile:
[Unit]
Description=Telegraf
Documentation=https://github.com/influxdata/telegraf
After=network-online.target
Wants=network-online.target

[Service]
Environment="INFLUX_TOKEN=YOUR_TOKEN_HERE"
Type=notify
EnvironmentFile=-/etc/default/telegraf
User=telegraf
ExecStart=/usr/bin/telegraf -config /etc/telegraf/telegraf.conf -config-directory /etc/telegraf/telegraf.d $TELEGRAF_OPTS
ExecReload=/bin/kill -HUP $MAINPID
Restart=on-failure
RestartForceExitStatus=SIGPIPE
KillMode=control-group
LimitMEMLOCK=8M:8M

[Install]
WantedBy=multi-user.target
Again, enable and start Telegraf.
After setup of Telegraf is complete you will probably want to go back into Influx's web interface and play around with the Data Explorer to ensure you're seeing data flow. You can also start configuring graphs here, but really that's better done in Grafana, which we'll set up next to finish the TIG stack.
Grafana
This is the visualization frontend/dashboarding engine. Grafana is not available
in Fedora, but they host a repository which can be easily added - details on how
to add it to your system are in their
documentation.
Then use dnf to add Grafana and don't forget to start and enable it.
All the configuration is done over the web interface, which is exposed on port
3000/tcp. Log in as admin/admin, change the password, and start creating
users, dashboards, and visualizations.
I found it easiest to play around with the Flux query in InfluxDB's editor, then copy & paste the Flux source into Grafana, and finally added some formatting and eye candy to the visualization. You can add one of more panels to the dashboard(s) as you grow your graphing interests. Here's an example of what mine looks like so far:
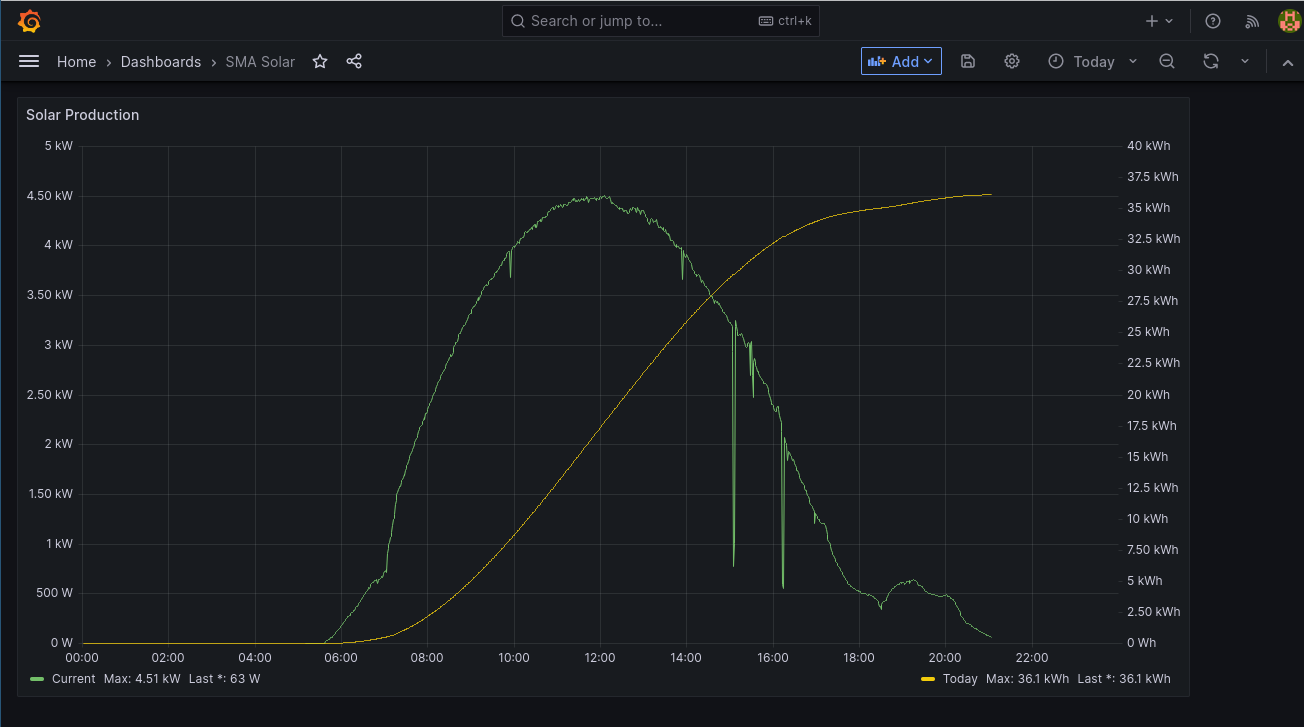
Some customization went into this. I created two Y axes, left for current output and right for production today. The legends call out the last and maximum values as appropriate, and one can easily navigate the graphs using the data picker and other controls at the top. Using the mouse one can zoom and pan around, and inspect values. The interface plays well also with mobile browsers, within the limits of touch screens.
RRDtool
Tobias Oetiker's RRDtool has been playing a central role in graphing data for the past two and a half decades. If you've used things like Cacti, Nagios or other network monitoring tools, that's what they use in some form or fashion.
The nice thing about a round-robin database is that it gets created occupying its full size and then does not grow as more data gets added into it. RRDtool will take care that old data gets thinned out by reducing the sample rate as new data gets pushed into the database. The idea being that typically one wants maximum resolution for relatively recent data while it is ok for older data to get downsampled to less resolution as old data is normally evaluated over longer spans of time. So you get a week's worth of data at 5 minute intervals, while yearly data is maintained at 1 hour intervals, for example.
RRDtool is available as a package for most distributions, for Fedora it's simply
called rrdtool. Install it using the usual means.
RRDtool also requires a three-step approach: setting up the database(s), devising a way to store data points into them, and running a retrieval command to show what we've got.
Setup
The databases are created first. It is possible to store all three values inside
one RRD, but for simplicity's sake I created one file each. At creation time it is
necessary to specify what we're storing, the minimum and maximum values each
dataset can assume, and how we want the thinning out to be handled. rrdtool is
typically invoked with a command and then a - sometimes lengthy - list of
arguments. Here are the commands:
mkdir -p house/solar
rrdtool create house/solar/current.rrd \
DS:val:GAUGE:600:0:10000 \
RRA:MIN:0:360:576              \
RRA:MIN:0:30:576               \
RRA:MIN:0:7:576                \
RRA:AVERAGE:0:360:576          \
RRA:AVERAGE:0:30:576           \
RRA:AVERAGE:0:7:576            \
RRA:AVERAGE:0:1:576            \
RRA:MAX:0:360:576              \
RRA:MAX:0:30:576               \
RRA:MAX:0:7:576

rrdtool create house/solar/today.rrd \
DS:val:GAUGE:600:0:50000 \
RRA:MIN:0:360:576              \
RRA:MIN:0:30:576               \
RRA:MIN:0:7:576                \
RRA:AVERAGE:0:360:576          \
RRA:AVERAGE:0:30:576           \
RRA:AVERAGE:0:7:576            \
RRA:AVERAGE:0:1:576            \
RRA:MAX:0:360:576              \
RRA:MAX:0:30:576               \
RRA:MAX:0:7:576

rrdtool create house/solar/total.rrd \
DS:val:GAUGE:600:0:100000000 \
RRA:MIN:0:360:576              \
RRA:MIN:0:30:576               \
RRA:MIN:0:7:576                \
RRA:AVERAGE:0:360:576          \
RRA:AVERAGE:0:30:576           \
RRA:AVERAGE:0:7:576            \
RRA:AVERAGE:0:1:576            \
RRA:MAX:0:360:576              \
RRA:MAX:0:30:576               \
RRA:MAX:0:7:576
You can see we first create house/solar as a directory structure, and then
create the 3 databases with the same name as the MQTT topic name. This will make
feeding data into them extremely straightforward.
The RRA parameters define how the resampling works. We're saving 576 values for the past 7 days, then 576 values for the past 30 days, and another 576 values for the past 3 years. This is the same for the minimum, average, and maximum values. For the average only, we are also saving 576 values for the past 1 day (24 hours) so the daily graph has a really good resolution. We're doing this only for the average value since it's the one we use for graphing.
Having done this we admire the result:
$ du -sk *
48  current.rrd
48  today.rrd
48  total.rrd
48 kilobytes for 3 years of each value, and this is the final size - it will not grow. How's that for efficiency? Within 1GB of disk space we could store close to 21 million different data points at this resolution with 3 years retention time, the database would maintain and clean itself out, and we'd never run the risk of being left with no disk space.
Storing Data
Storing data points is the most straightforward command. Essentially you run
rrdtool update <rrd_file> <time_spec>:<value>. <rrd_file> is the database
file we want to update, <time_spec> can be a date/time specification or just
simply "N" for "now", and <value> is, of course, the value we want to store.
The following two scripts will handle the updates.
First, we subscribe to the topics of interest using trusty mosquitto_sub:
#!/bin/bash
#
# wrapper to start via systemd
#
/usr/bin/mosquitto_sub -h 192.168.2.24 -v -t house/solar/\# | /home/solar/bin/mqtt_to_rrd
Invoked thusly mosquitto_sub will spit out a line of text on
stdout whenever a new message is received on any sub-topic of house/solar
formatted like this:
house/solar/total 598275
house/solar/today 36145
house/solar/current 215
These lines get piped into the second script, mqtt_to_rrd:
#!/bin/bash
#
# get MQTT values and store them in RRD
# assumes RRDs already exist

while [ 1 ]
do  read topic value || exit
    rrdtool update "/home/solar/rrd/${topic}.rrd" N:${value}
done
You can see the while loop runs forever. read stores the topic and value into
two variables, and they in turn get passed to the rrdtool update command. Then
the loop continues, attempting to read whatever message comes next.
You can now also see why I chose to name the RRD database files exactly like the topics - it doesn't get more straightforward than this.
One final piece in the puzzle is the auto (re-)start. Should any of the commands crash then this script will terminate, and so will the wrapper script as it's pipe on stdout is broken. In this case we want the thing to restart as we don't want to miss out on our precious data!2
So we should have a systemd unit to start this, and also make sure it gets
started automatically at server boot time. Easy enough:
[Unit]
Description=MQTT to RRD consumer
Wants=syslog.service

[Service]
Restart=always
ExecStart=/home/solar/bin/mqtt_wrapper
ExecReload=/bin/kill -HUP $MAINPID
# Type=simple
User=solar
Group=solar

[Install]
WantedBy=multi-user.target
systemd cannot start command pipes; otherwise the wrapper script would not
have been necessary. Copy this into /etc/systemd/system/mqtt_rrd.service and
run systemctl daemon-reload; systemctl enable --now mqtt_rrd and we're in
business.
Leave this running for a few minutes and you should see the access time of the RRD files being updated.
Retrieving Data
Ok, so how do we look at the data now? You guessed it, using another command - in
this case rrdtool graph. This is easily the most complex of the incantations
and really the sky is the limit as to how complex you want to make it. Here's an
example to create a graph of today:
rrdtool graph solar.png --end 23:59 --start end-1d --width=1024 --height=550 \
  --title "Solar Production" --vertical-label "Wh produced today" \
  --watermark "`date`" --x-grid "HOUR:1:HOUR:6:HOUR:6:86400:%d.%m.%Y %H:%M" \
  --right-axis 0.1:0 --right-axis-format %1.0lf --right-axis-label "W current production" \
  --upper-limit 50000 --lower-limit 0 \
  DEF:current=house/solar/current.rrd:val:AVERAGE \
  DEF:today=house/solar/today.rrd:val:AVERAGE \
  DEF:total=house/solar/total.rrd:val:AVERAGE \
  CDEF:scaled_current=current,10,* \
  COMMENT:"                ------------------------------------\n" \
  COMMENT:"                    Current        Maximum\n" \
  COMMENT:"                ------------------------------------\n" \
  HRULE:0#000000 \
  LINE1:scaled_current#0000FF:"current" \
  GPRINT:current:LAST:"        %8.2lf %s"  \
  GPRINT:current:MAX:"    %8.2lf %s\n"  \
  LINE1:today#FF0000:"  today" \
  GPRINT:today:LAST:"        %8.2lf %s"  \
  GPRINT:today:MAX:"    %8.2lf %s\n"  \
  GPRINT:total:LAST:"    total production to date\: %8.2lf %sWh"
And this is an example of the graph it creates:
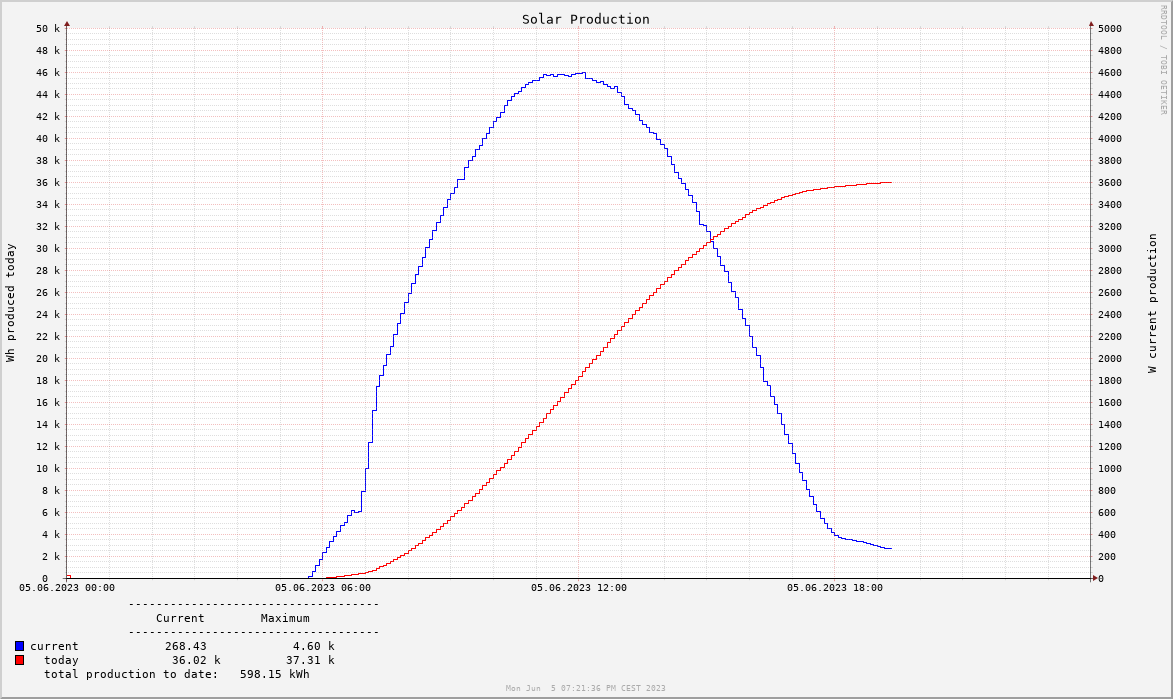
The DEF lines define graphable values from the RRD databases, the COMMENTS and GPRINTS print out the numeric values and legend, while the LINE1 statements draw a line of type "1" with the values over time. There are lots of other styles available as well, like stacked bars, interpolated curves, fancy color schemes, etc. RRDtool mastery can become its own hobby.
As opposed to Grafana, rrdtool does not allow to manually or automatically
scale values separately with different Y axes. This is the reason for the CDEF
command, which brings the current production values into the maximum range of
the daily production maximum, thus approximating best-fit autoscaling. The
--right-axis* parameters add the necessary eyecandy on the right Y axis to
perfect the illusion. This is much less flexible and intuitive than Grafana's
way of handling it, but it is what it is.
Graphing is only one way to retrieve data. For example you can also obtain CSV
output or handy JSON objects which are great for further processing in other
software. Refer to the manual page for rrdgraph and the great documentation
on Tobi's website to understand more about RRDtool's options and possibilities.
Note that unlike TIG, RRDtool does not provide any way to access the data and/or
graphs remotely, at least not out of the box. If web browser access is required
for example, you need to build a solution to generate and store the graphs,
either in regular intervals via cron, or using e.g. a CGI web server that
fires the rrdtool graph and returns the result.
Comparison of the Approaches
Ceterum censeo it is fair to say that RRDtool offers a fascinating alternative to the TIG stack. It's a different approach, has different goals and constraints, and is sure to appeal to a different crowd. Both options have their pros and cons, namely:
Amount of Code: The TIG stack is huge. As of this writing the packages are: Grafana: 75MB, Telegraf: 170MB, InfluxDB container: 270MB. So in total over half a gigabyte installed, and multiple services running. To be fair, this includes the MQTT consumer, two complete web interfaces, and a lot of things that we don't use but that do come in handy if in the future you want to do more. By contrast, RRDtool is a mere 570 kB, so just over half a megabyte. That's a factor of 1000 less, but it doesn't include all those niceties. Generally, if your goal is to make the smallest, most stable, and least error-prone setup, RRDtool is your friend.
System Load: Along the same vein, the TIG stack consumes a bit of CPU and around half a gigabyte of memory in this extremely low-load scenario. If you have the memory it's no big deal, if you want to run this on a Raspberry Pi 2 it may well be.
RRD versus Time Series: These are two different use cases. RRDs aim to be size-constant, minimum overhead, maximum performance, but at the cost of flexibility. Set the wrong maximum values? You have to recreate the RRD, losing all your existing data. Want to change retention or resolution? Same. By contrast the time series database ingests values as they come, with no assumptions as to resolution, retention, or later calculations. The downside is the much bigger overhead, growing disk space, and necessity to at least keep an eye on the database and do some cleanup eventually. That being said, in this specific scenario a few gigabytes of disk storage will go a very long way.
Usability: Having a super flexible web interface with a query language and a full-blown database is nice. Having a very narrowly-focussed solution with minimal moving parts which you set up once and then forget is also nice.
Closing Thoughts
I've shown two opposites here, "batteries and kitchen sink included" and "just the basics, ma'am". There is middle ground, and a lot of it. For example collectd is a system statistics collection daemon with assorted frontends that uses RRDs on the back end. Some network monitoring systems can also be adapted to collect arbitrary statistics and provide web interfaces to them, such as Cacti. Most of them are much more limited than Grafana, however, and most require some massaging of the code and configuration.
Maybe having web access also isn't the ideal way to deliver this data. Let's say you want a report of how the day went 30 minutes after sunset. RRDtool graphs are small PNGs or JPGs that require no interaction. It would be easy to create a cron job to generate a graph and have it mailed out or sent to you via an instant messaging bot.
The sky truly is the limit. There's always something to add or tinker with. And, because you built it, you can fix it.
-
I don't have the use case of checking this data while on the road, but if you do it would be easy to add broker-to-broker communication to connect remote consumers the same way. ↩
-
An interesting little detail is the use of
read [...] || exit. Spoken out loud this would be "read or exit". It catches the eventuality of themosquitto_subcommand crashing or being killed. Thewhileloop would continue indefinitely withreadreturning empty-handedly since its input has been severed. The "or exit" condition will catch this asreadreturns with an error, thus executingexitwhich will break out of the loop, terminating the whole script. ↩